S-Curve Analysis is a tool within the TRIZ methodology used to analyze and predict the lifecycle of a technology, product, or system. It helps innovators understand how a system evolves over time, identify where it is in its lifecycle, and make strategic decisions about future development. The S-Curve is shaped like an “S” and represents the stages of growth, maturity, and decline that most technologies, products, or systems experience.
The S-Curve Stages
The S-Curve typically consists of four key phases, which describe the evolution of a technology or product over time:
- Introduction (Startup Phase):
- Characteristics: In this early phase, the system or technology is new, and progress is slow. Efforts focus on research, development, and overcoming initial technical challenges. The system’s performance is low, and the market penetration is limited.
- Key Challenges: High levels of uncertainty, experimentation, and investment without significant returns. Growth is gradual as people adapt to the new concept.
- Innovation Activity: Exploratory innovation, lots of trial and error, prototype development.
- Growth (Accelerating Phase):
- Characteristics: In this phase, the system’s performance improves rapidly as technical challenges are overcome, and optimizations are made. This leads to increased adoption and growth in market share. Technological breakthroughs often occur, allowing the system to evolve quickly.
- Key Challenges: Rapid innovation and scaling. Competition increases as more companies enter the market, and there’s a strong focus on improving efficiency and capabilities.
- Innovation Activity: Exploiting the potential of the system and expanding into new markets or applications.
- Maturity (Stabilization Phase):
- Characteristics: In this stage, the system’s performance levels off. Improvements become incremental and harder to achieve. The technology reaches its full potential, and the system becomes standardized. Market saturation occurs, and further innovation yields diminishing returns.
- Key Challenges: Achieving marginal improvements becomes expensive and difficult. There is less room for disruptive innovation, and businesses often focus on cost-cutting or refining processes.
- Innovation Activity: Incremental innovation, refining existing systems, optimizing costs, and improving efficiency.
- Decline (Saturation and Phase-Out):
- Characteristics: At this stage, the system becomes obsolete as newer technologies or innovations surpass it. The market shrinks, performance stagnates or declines, and the system is gradually replaced.
- Key Challenges: Companies face declining demand, the product becomes less competitive, and the cost of maintaining it may outweigh the benefits.
- Innovation Activity: Little to no innovation; the focus shifts to managing decline or transitioning to a new technology.
S-Curve Diagram
The S-Curve itself is a graphical representation of these phases. The x-axis represents time or effort (e.g., resources, investments), and the y-axis represents performance (e.g., efficiency, capability, market share).
- Introduction Phase: The curve starts flat as performance increases slowly.
- Growth Phase: The curve steeply rises as the technology begins to gain significant momentum.
- Maturity Phase: The curve flattens out again as growth slows down and incremental improvements become difficult.
- Decline Phase: The curve may decline or flatten out completely as the technology becomes obsolete.
How S-Curve Analysis Is Used
- Assessing the Current Position
- S-Curve Analysis allows innovators to evaluate where a product, technology, or system currently is in its lifecycle. This helps companies decide whether to continue investing in incremental improvements, shift focus to new innovations, or prepare for obsolescence.
- Strategic Planning for Innovation
- Understanding the current phase on the S-Curve helps companies plan their R&D and innovation strategies. For example:
- Early Stage: Focus on foundational research and development.
- Growth Stage: Invest in scaling, expanding applications, and optimizing performance.
- Maturity Stage: Focus on cost-efficiency and incremental improvements.
- Decline Stage: Shift focus to newer, disruptive technologies or begin transitioning out of the market.
- Timing of New Technologies
- S-Curve Analysis helps companies determine when to adopt or develop new technologies. For example, if a product is reaching the maturity or decline phase, it may be the right time to explore breakthrough innovations to launch a new S-Curve.
- Technology Forecasting
- By analyzing where a system is on the S-Curve, companies can make more informed decisions about the future potential of their technologies. If a product is nearing maturity, they can anticipate diminishing returns and begin exploring disruptive innovations.
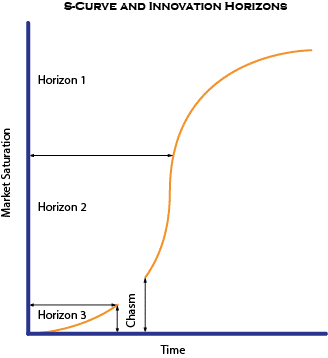
S-Curve in Relation to Innovation Horizons
S-Curve Analysis aligns with the Three Horizons Framework used in innovation management:
- Horizon 1: Represents the maturity phase of the current core business, where incremental innovation is the focus.
- Horizon 2: Represents the growth phase, where emerging innovations and scaling of new ideas take place.
- Horizon 3: Represents the introduction phase, where disruptive and radical innovations are being researched and developed for future growth.
By using the S-Curve alongside Horizon Planning, companies can better manage their innovation portfolios, balancing short-term and long-term innovation efforts.
Practical Example of S-Curve Analysis
Let’s look at the evolution of smartphones:
- Introduction Phase (Early 2000s): Early smartphones like the PalmPilot or the first BlackBerry were clunky, expensive, and had limited features. Their market penetration was slow as companies struggled to overcome technical challenges.
- Growth Phase (Mid-2000s to 2010s): With the introduction of the iPhone in 2007, smartphones saw rapid growth. Features improved quickly, and market penetration skyrocketed. Each new iteration brought significant advances in technology, design, and functionality.
- Maturity Phase (2015 to present): Today, smartphone innovation has plateaued, and advancements are mostly incremental, focusing on minor improvements like camera quality, battery life, and processing power. The market is saturated, and significant breakthroughs are harder to achieve.
- Decline Phase (Potential Future): At some point, smartphones may be replaced by new technologies such as augmented reality (AR) glasses or other wearables, leading to a decline in demand and innovation.
Benefits of S-Curve Analysis
- Innovation Management: Helps companies manage their innovation efforts more effectively by identifying when to shift focus between incremental and radical innovations.
- Resource Allocation: Guides decisions on where to allocate R&D resources based on where a product or technology is in its lifecycle.
- Competitive Advantage: Identifying an emerging technology early in its S-Curve can give companies a significant advantage in the market.
- Strategic Forecasting: Enables companies to plan for technological disruption by predicting when a current system or product will become obsolete.
Conclusion
S-Curve Analysis is a powerful tool for understanding the lifecycle of technologies and systems. By identifying where a product or technology is on the S-Curve, companies can make informed decisions about resource allocation, innovation strategy, and future planning, ensuring they remain competitive in evolving markets.